

In September 2020 the World Economic Forum, in conjunction with the International Business Council and all ‘big 4’ accounting firms, published a white paper titled “Measuring Stakeholder Capitalism: Towards Common Metrics and Consistent Reporting of Sustainable Value Creation”. The paper outlines a strategy for the development and implementation of global standards for ESG reporting. It includes metrics for Governance, People, Planet and Prosperity, emphasizing the ‘belief that the interrelation of economic, environmental and social factors is increasingly material to long‑term enterprise value creation’. We applaud this initiative strongly. However, it does not address the critical link between enlightened business practices with respect to People and Planet and their impact on individuals’ Preferences and the buying decisions that deliver Prosperity.
This is a problem because, only through such informed consumer choice, can businesses and brands create value sustainably and can the resources of the global economy be channelled at scale into more sustainable models of production, distribution and consumption. ‘You manage what you measure’. Only by establishing line of sight metrics from engagement with brands as authentic ambassadors for responsible business to quantified financial outcomes will business leaders be able to embed such principles at the heart of their strategies and operating models.
This is a problem because, only through such informed consumer choice, can businesses and brands create value sustainably and can the resources of the global economy be channelled at scale into more sustainable models of production, distribution and consumption. ‘You manage what you measure’. Only by establishing line of sight metrics from engagement with brands as authentic ambassadors for responsible business to quantified financial outcomes will business leaders be able to embed such principles at the heart of their strategies and operating models.
OVERVIEW
The Brand Experience Group operates a unique research and advanced analytics platform called the MCA® that establishes line-of-sight from engagement with brands to preference and choice through a common Brand Experience currency. It is a robust predictor of business performance that has been established for over twenty years.
The “MCA for Sustainability” is built on these proven foundations. It allows businesses to understand how effectively their brands are delivering their sustainability narrative to citizens and consumers, how this is impacting preference and choice, and how this translates into brand “Sustainability Dividends” and shortfalls (or opportunities) that add to or subtract from the value of the brand and the business.
Individuals do not engage with corporate ESG strategies, they engage with causes and brands in a local and cultural context. Authentic narratives for brands as ambassadors for sustainable business models need therefore to be activated in a way that is relevant to a category, market and even occasion. The “MCA for Sustainability” provides a toolkit that is designed to help brand owners improve performance by revealing which sustainability issues are most important to individuals in a particular category, and where brands should focus their efforts.
WHY THIS IS IMPORTANT
By revealing and quantifying the direct impact of sustainable business practices on performance in terms of market shares and growth, the MCA for Sustainability provides the business case for investments in sustainable business practices.
It allows investors to quantify and realise the opportunities associated with improving business behaviours and better articulating the positive environmental and societal contributions being made, encouraging capital flows towards businesses that are investing for our collective future.
It enables business leaders to enhance and act on their commitment to establish strategies and operating models that deliver positive environmental and societal impacts because they can demonstrate how this delivers better financial returns.
It provides brand marketers with the metrics they need to understand and improve how effectively they are delivering their sustainability narratives to citizens and consumers and how these are impacting preference and choice.
HOW IT WORKS
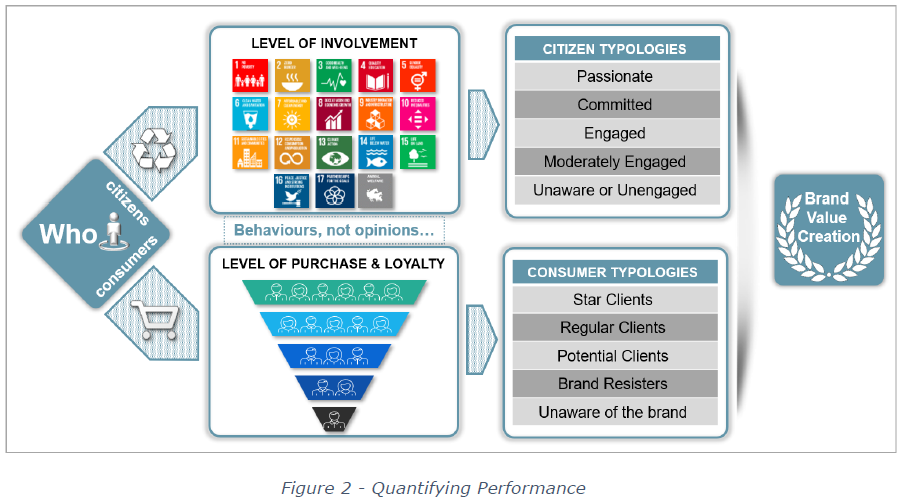
The process starts by segmenting individuals based on their behaviours as both citizens and consumers, reflecting their commitment to sustainability causes and engagement with the specific issues and causes relevant to a particular product category:
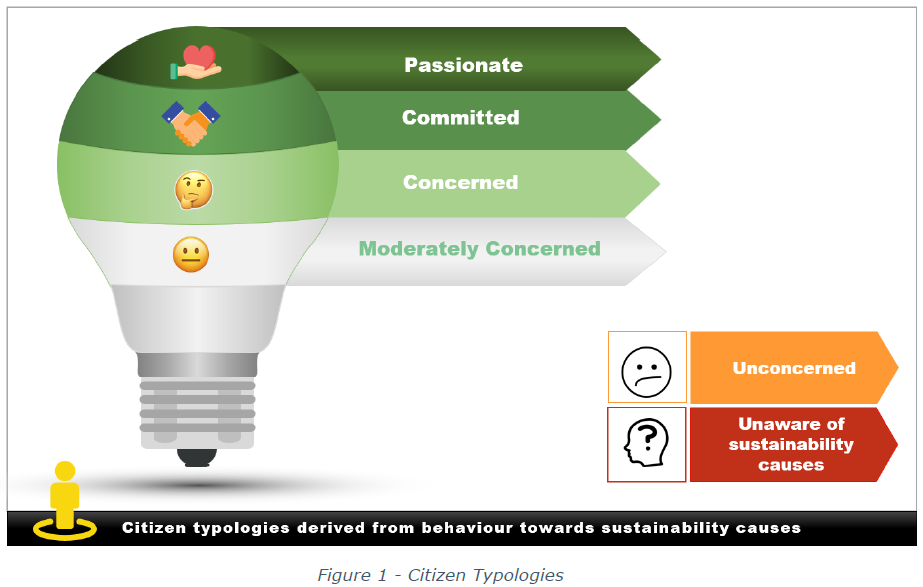
Citizen typologies: How they relate to all aspects of sustainability, e.g. which causes do they relate to, how many, how involved are they and how this impacts their behaviour with respect to particular categories and brands. This is built on the UN Sustainable Development Goals (SDGs) framework so is universally applicable (Figure 1).
Consumer typologies: Which brands different socio-demographic segments are choosing, how they are experiencing these brands through which touchpoints and activities, and how much they are associating these brands with their environmental and societal sustainability credentials.
We also classify the brands in a category according to the causes they associate with and support, and the accreditation labels they use on their packaging and other materials. This allows a granular analysis of what causes and accreditations have most impact with different citizen typologies in a local market context.
We analyse the intersection of people as Citizens and Consumers to understand which brands in a category are achieving better performance among Citizens who are strongly engaged and motivated by a brand’s sustainability characteristics.
INTRODUCING THE PERFORMANCE METRICS
The robust correlation of MCA-based Brand Experience Share metrics with Market Share movement allows us to quantify the “Sustainability Dividend” or shortfall for a brand based on consumer perceptions of brand purpose and sustainability impact, and how that translates into preference and choice.
Brand Sustainability Dividends (BSDs)
We are able to quantify how much more (or less) a brand is achieving in terms of sales because of its societal and environmental impact and how that is communicated. This is the Brand Sustainability Dividend (BSD) or shortfall:
- This is done by looking at brand performance through the lens of Citizen typologies.
- If a brand is achieving stronger performance amongst citizens who care about sustainability, it is achieving a Sustainability Dividend.
- If a brand is under-performing among citizens who care about sustainability versus the broader population, it has a shortfall i.e. it is leaving value on the table. This is equally important to quantify, because it defines the ‘size of the prize’ that can be realized by improving the business model behind the brand or just better communicating the social and environmental impact the brand is making.
By aggregating Sustainability Dividends across brands and markets, a business can track the incremental revenue and share achieved by its brands as ambassadors for sustainable business behaviours and identify opportunities to improve the impact made for each brand and market. In the example below (Figure 3) we are able to show how each brand in this portfolio is performing and the size of the performance improvement prize that the business can realize through better practices, better communication or both.
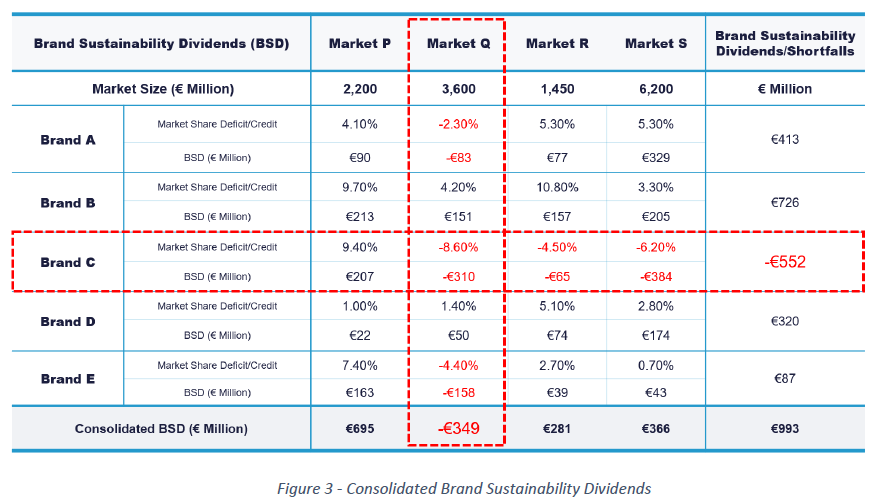
- Brand C where there is a shortfall across markets of €552 million; and
- Market Q where multiple brands are leaving value on the table, amounting to a shortfall of €349 million (including Brand C).
UNDERSTANDING BRAND OPPORTUNITIES AND RISKS
Most businesses are already working on establishing the right environmental and social impact metrics to understand their ESG performance, setting the right goals and tracking progress. Their progress versus these metrics is represented by the x-axis in Figure 4 below, which can also reflect external ratings by leading sustainability ratings agencies.
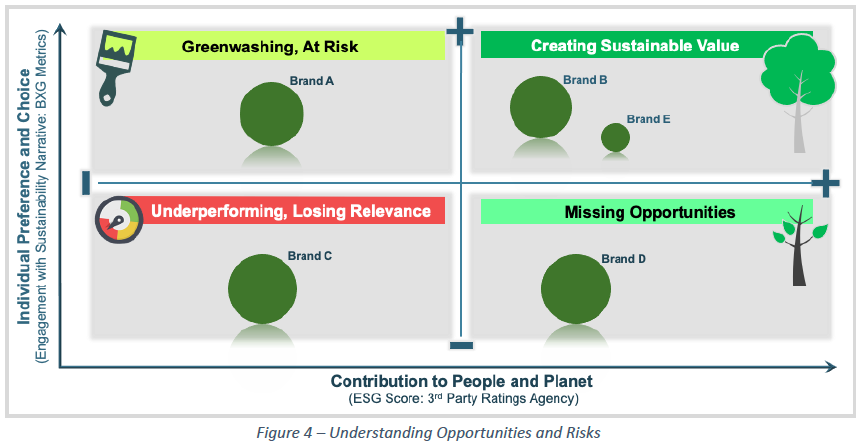
Businesses also need to understand whether these commitments and efforts towards the environment and society are being communicated effectively to their consumers. Aligning actual performance, as measured by ESG ratings metrics, and individual engagement with a brand’s narrative is critically important to tracking and managing opportunities and risks. The ‘2x2’ in Figure 4 visualizes this:
- Top right - high on both corporate commitment & consumer choice: The brand is delivering a strong ESG performance and this is being effectively communicated via the brand’s sustainability narrative. The brand is making a positive impact and Creating Value Sustainably. Further strengthen the business case, do more of the same and re-apply best practices across other brands and markets.
- Bottom right - high on corporate commitment but low on preference and choice: The brand is delivering a strong ESG performance, but not delivering an effective sustainability narrative. The brand is Missing Opportunities to make an impact and leaving value on the table. Establish the business case for telling the story and build an effective narrative and communication strategy.
- Top left - low on corporate commitment but high on preference and choice: The brand is telling a compelling story on sustainability but it is not grounded in actual ESG performance realities. The business and brand are in a risky position - this is Green-Washing. Act urgently to develop a corrective action plan that addresses both ESG performance shortcomings and with respect to People and Planet and the communication strategy.
- Bottom left - low on both corporate commitment & positive impacts on consumer choice: The actual ESG performance is weak and the brand’s sustainability narrative is similarly weak. The brand is likely to struggle to avoid Losing Relevance unless some fundamentals are addressed. Establish the governance structure needed to embed a new sustainability strategy and associated operating model.
CONNECTING TO FINANCIAL METRICS
Capital flows are increasingly favouring businesses that exhibit good practice in terms of governance, societal impact and environmental contribution. This is contributing to accelerating valuations for the most sustainably run businesses. For example, the 5-year performance of the Dow Jones Sustainability Group Index recently outperformed the Dow Jones Global Index by 36% over the same period.
Sustainability related revenue growth opportunities, associated net margins and sector valuation multiples combine to provide a powerful leading indicator for the incremental enterprise value available to investors and business leaders who put the principles of sustainability at the heart of their business operating models and brands.
Introducing the Quadruple Bottom Line
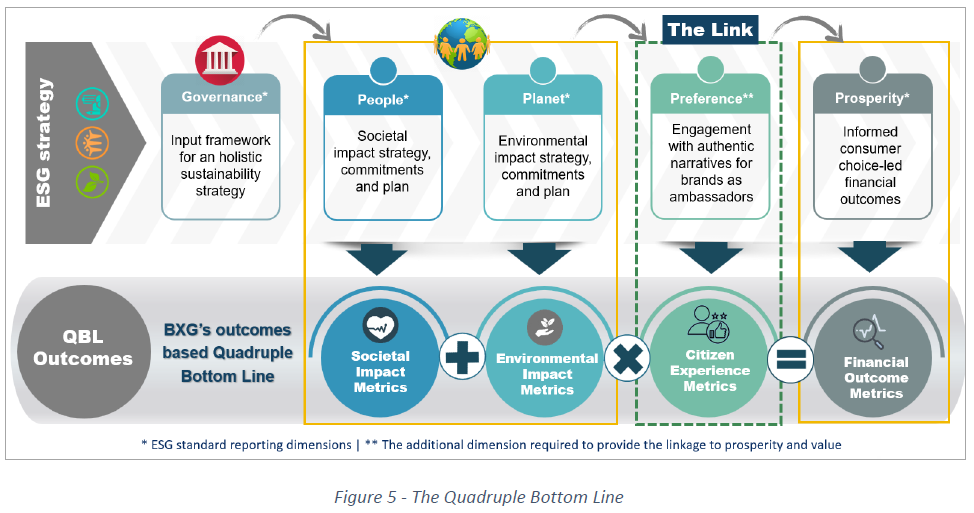
The Brand Experience Group’s Quadruple Bottom Line outcomes-based reporting model (Figure 5 below) provides companies and investors with the understanding of how the business is performing in terms of delivering sustainable value creation, benchmarks vs category competition, and a set of priorities on what to do next.
It is fully consistent with the WEF/IBC framework with the addition of one important dimension, the Preference and choice metrics that describe citizen and consumer engagement with brands as ambassadors for sustainable business operating models.
The ‘Quadruple Bottom Line’ model, made possible by the “MCA for Sustainability”, combines individual preference and choice with other business outcomes across:
- People: The contribution to society as reflected in metrics such as those related to diversity & inclusion, pay equality, wage levels, child/forced labour, health and Safety, broader health outcomes, training for the future and worker rights
- Planet: The contribution to our environment as reflected in metrics such as those related to the Paris-aligned greenhouse gas emission targets, air pollution, elimination of single-use plastics, TCFD implementation, and use and ecological sensitivity and fresh water conservation.
- Preference – our unique contribution: The impact of communicating all of this well on preference and choice across different citizen typologies as reflected in metrics such as category touchpoint influence, touchpoint multiplier effects, brand associations, Brand Experience, Brand Experience Share and sales conversion.
- Prosperity: The resulting economic health that is generated as a result for businesses, communities and individuals which makes possible virtuous circles of sustainable investment and economic development.
INTRODUCING THE MCA FOR SUSTAINABILITY DIAGNOSTICS
The ‘MCA for Sustainability’ is built on a detailed understanding of citizen and consumer behaviours, providing a comprehensive diagnostic toolkit to enable marketing and sustainability teams to work together to develop and deliver sustainable performance improvement strategies. The diagnostics reveal which activities are most engaging, which sustainability initiatives are most relevant, and how brand experience and sustainability narratives can be strengthened to realize performance improvement opportunities.
The illustrations below show examples taken from a recent UK study into the Non-Alcoholic Drinks sector, highlighting metrics such as Touchpoint Contribution and Sustainability Impact by citizen typology, benchmarked versus competing brands.
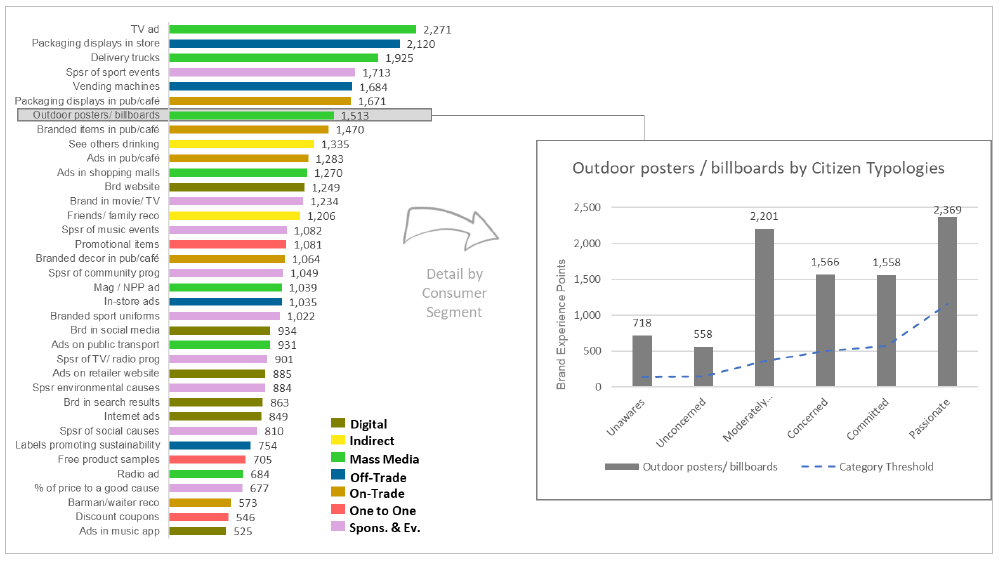
- Touchpoint Contribution: Which activities are generating the most brand experience, and which connect most effectively among the sustainability citizen typologies?
-
What the largest/smallest contributors of brand experience are, as measured by the unifying currency of Brand Experience Points (BEPs):
This supports good decision making by ensuring the largest contributors are fully supported and highlighting the budgets and resources allocated to the smallest contributors as potential opportunities to improve performance. -
How the contribution of BEPs for each activity varies across citizen and consumer typologies:
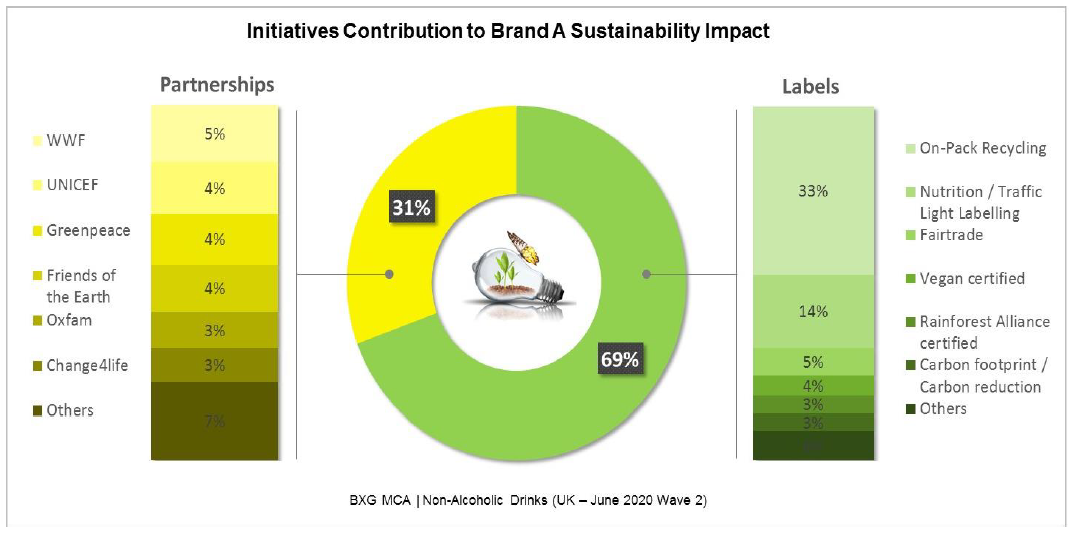
This clarifies which activities are most relevant to a specific audience and marketing task. - Sustainability Impact: How is my brand performing in delivering its sustainability narrative to consumers? Which sustainability initiatives are driving this most effectively?
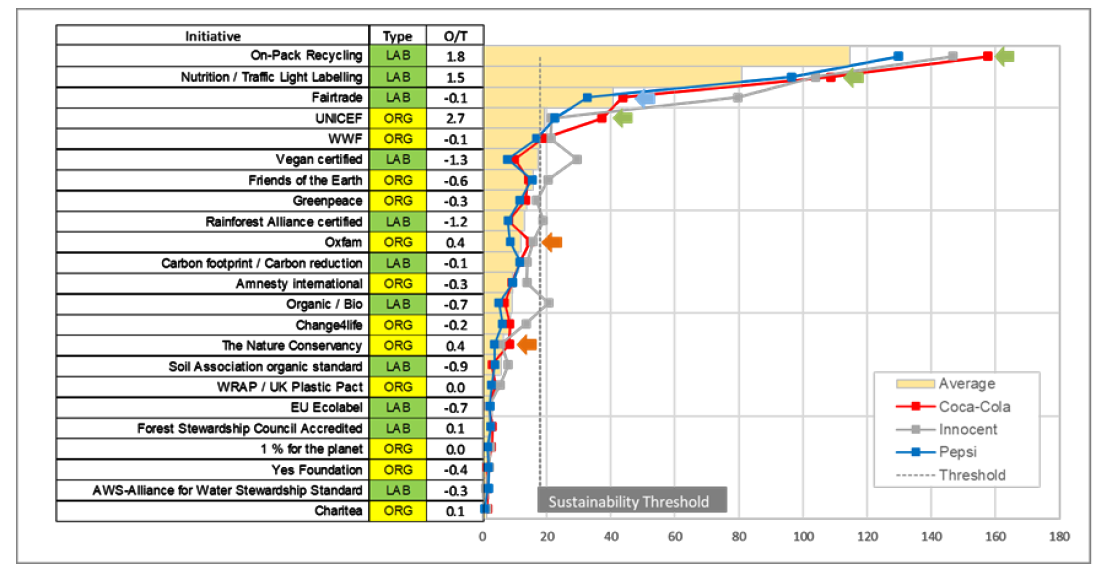
- Benchmarking: How is my brand benchmarking on perceived sustainability impact vs. key competitors? Where do we need to improve performance to win?
 In this example the brand can establish a number of key facts:
IN CONCLUSION
There are three major take-aways from this:
First, this is ground breaking. The lack of a way of quantifying the sustainability dividend or shortfall (i.e. opportunity) for a brand has presented the single biggest impediment to businesses fully embracing more sustainable operating models. The Brand Experience Group has now solved this problem.
Second, the scale of the opportunity for leading brands is much larger than business leaders typically realise, providing strong economic incentives to invest in better ways of doing business and more effective ways of engaging consumers with authentic narratives for brands that stand for the right things.
Third, the implications are profound. If businesses are to lead the transformation to a more sustainable economy, as only they can, they have to take citizens and consumers with them on the journey. Only by harnessing the power of informed consumer choice globally can we deliver change at the scale and pace needed? Ultimately it will be the ideas, values and consumer connections with authentic brands as ambassadors for sustainable business behaviours that will shape our collective future.